

Why Analytics Matters

All the Insights You Need — Instantly
1. Funnel Drop‑Off Visualization
See exactly where users abandon the form. Highlighted bars show the weak spots so you can fix what’s killing conversions.
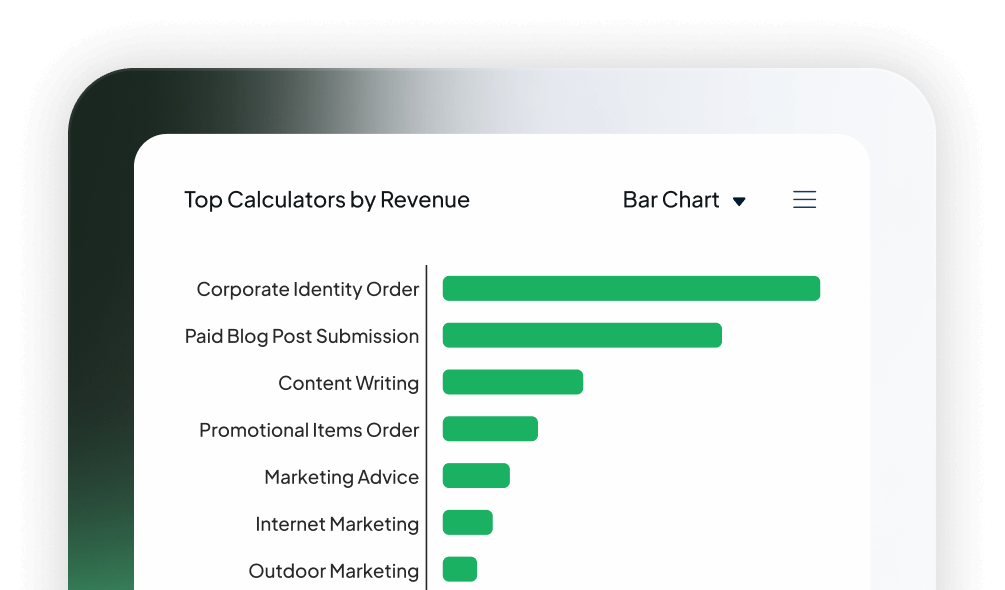
2. Field Performance Breakdown
Find out which sliders, radio buttons, or dropdowns drive engagement and which make users bounce. Understand the impact of every choice.
3. Revenue & Behavior Trends
Overlay revenue with user behavior to reveal patterns. See how specific actions impact payments and fine-tune your flow for maximum profit.
4. Smart Filtering
Break down data by date, status, product variant, or custom field. Get answers fast without digging through raw numbers.
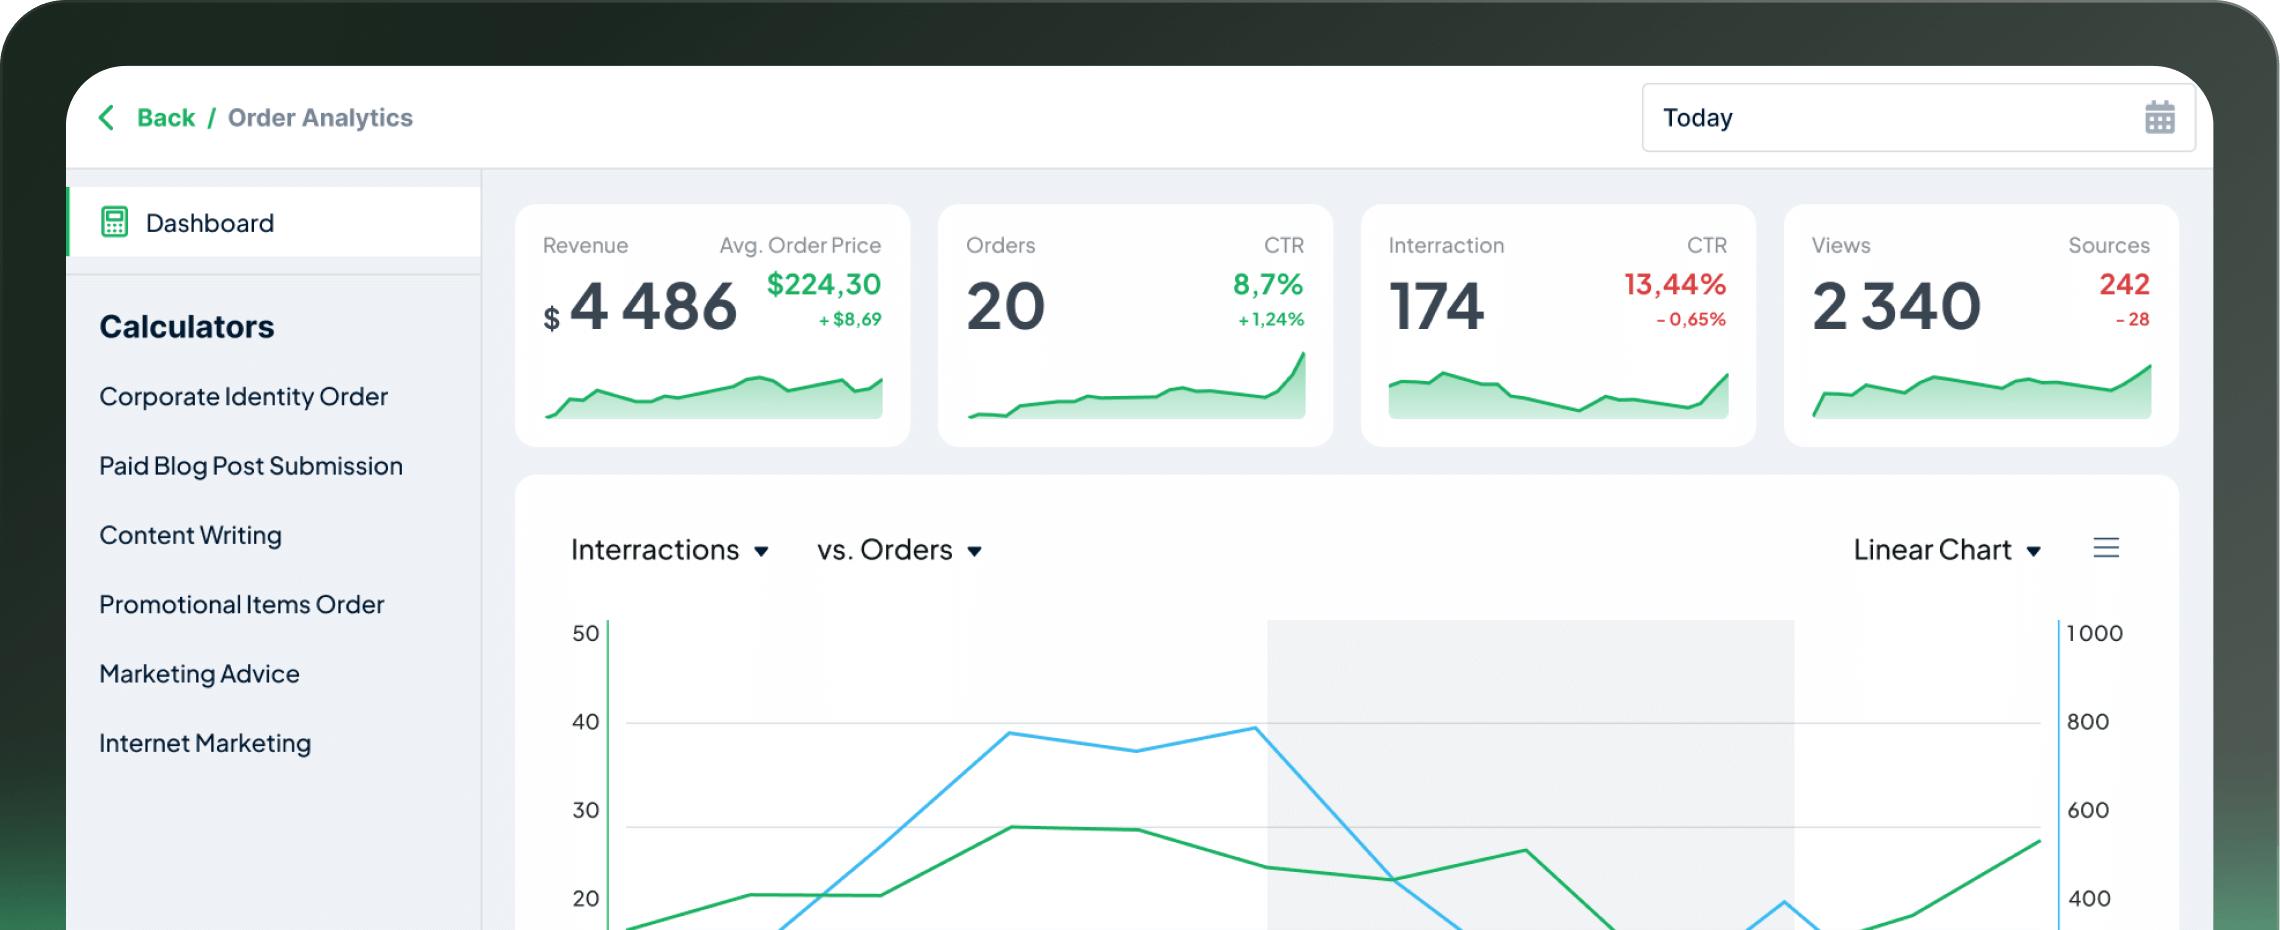
5. Real-Time, No-Code Reports
Dashboards update automatically. No need to set up reports, write SQL, or deal with Excel.
6. Widget-Based Layout
Build your own dashboard with line, bar, and pie. Create a layout that reflects your business goals and revenue priorities.

From Guessing to Growing
1. Know Exactly How Much You Earn
Track views, submissions, payments, and total revenue by day, week, or month. Your calculator is no longer a black box — it’s a measurable asset.
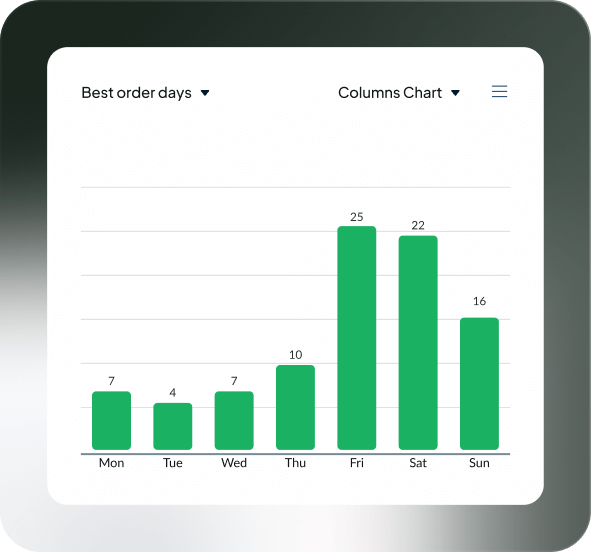
3. Track Trends, Spot Drops, Scale Wins
Get a clear view of growth patterns, seasonal spikes, and sudden dips. Measure the ROI of every change you make — and adapt fast.
2. Optimize Every Field for Conversions
See which steps stop users. Spot the fields that drive actions and remove the ones that confuse or distract. Data shows you what works and what doesn’t.
4. Make Your Calculator Work for Your Business
Use insights to cut friction, raise conversions, and drive more sales. Analytics help you make your calculator profitable.