Consulting stocks & charts
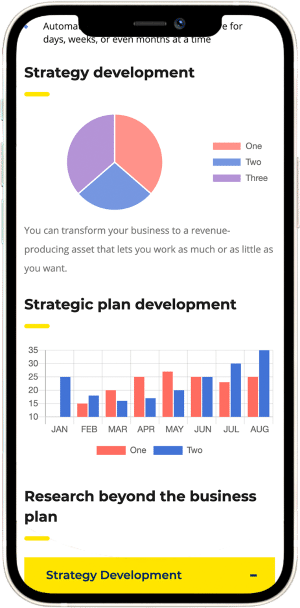
Monitor and analyze your business with data visualization tools.
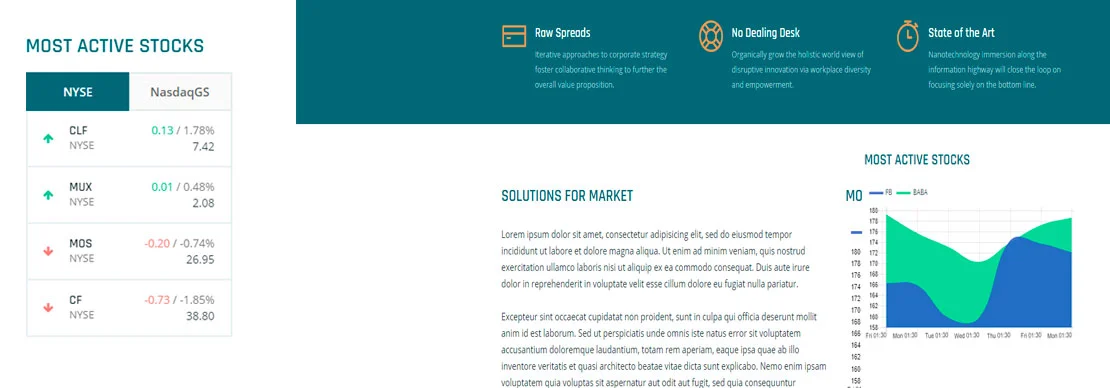

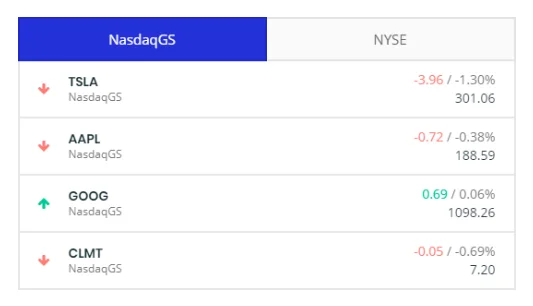
Best online stock options
Monitor and analyze your business like never before by saving and organizing the charts you're watching in custom Charts.
Create larger, more advanced charts with real-time intraday data, more indicators and overlays, auto-refresh, and much more.
Create and organize Chart Lists to make managing your business a breeze, and access everything from your desktop, laptop, smartphone, or tablet.


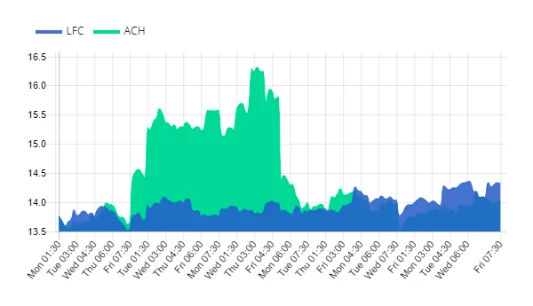
Use this visual representation for easier identification of price patterns and market changes.
Chart Element
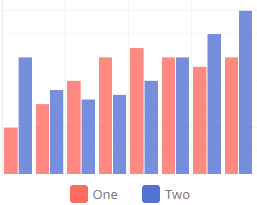
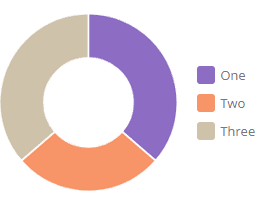
The Chart Element is an elegant, powerful and beautiful tool that allows you to publish gorgeous charts right on the page using Consulting.
With extremely simple to navigate branding options for colors, labels and positioning, the Chart Element brings form and function together beautifully.

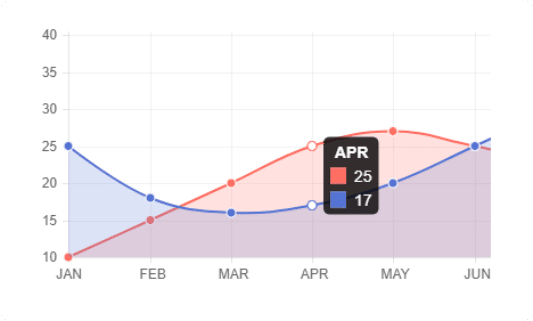
Intelligent tooltips
The Charts Element gives you the ability to have intelligent tooltips switched on or off on your charts.
This means you can display them as part of an online report, or have them show key data on the hover of the mouse. Whenever tooltip is turned on, it will use the key data from the chart section (dependant upon the chart type) to display it at the mouse cursor point.
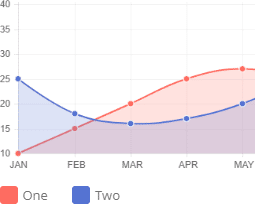
Fully customizable styling
Don’t worry about how the chart will integrate by appearance with your websites.
We offer full color customization for charts, border size and color options , to ensure that however you’d like to design your chart, it’s more than possible.
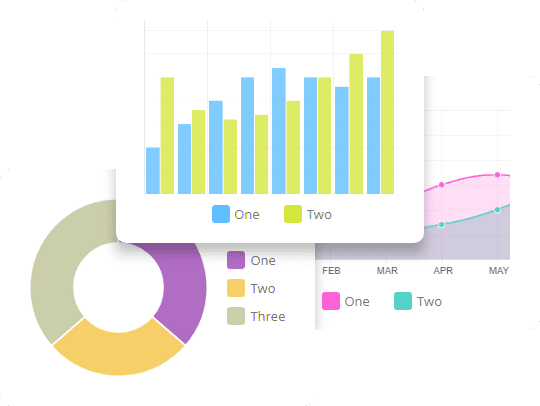
Mobile visibility settings
Our mobile visibility system gives you full control over what displays based on 3 customizable screen sizes.
Every Visual has these settings and they allow you to show or hide elements on various screen sizes. In addition, you can choose what those screen sizes are! This gives you maximum control to set the exact point when an element should show or hide. Resize the page to see the elements appear or disappear based on what we set.
by StylemixThemes.